NFL Analysis
1/13/24
5 min read
How Turnovers Helped, Hurt NFL Teams This Season

Turnovers and turnover differential are brought up on nearly every NFL broadcast, but the raw numbers don't tell the full story.
Most people have seen interceptions that aren't the quarterback's fault, whether because of a drop by the receiver, an unlucky bounce, etc. This article will try not to look at who's at fault, but it's important not to take numbers at face value.
Another important note that is often left out when just looking at the numbers is how important the turnovers were.
Some turnovers are definitely more significant than others, given the game situation. For example, an arm punt on third and long may not have as big of an impact as a red zone fumble that results in a touchdown for the defense.
One way we can help bring context to turnovers is by using Turnover EPA — the EPA lost or gained by turnovers. Let’s start with the teams who lost the most EPA on turnovers this season.
| Team | Turnovers | EPA Lost |
| Browns | 37 | -169 |
| Jets | 32 | -156 |
| Commanders | 33 | -149 |
| Vikings | 34 | -148 |
| Falcons | 30 | -138 |
For context, the Cleveland Browns' turnovers lost them an estimated 169 points for the season — or nearly 10 points a game. A good example of the importance of turnover involves the Los Angeles Chargers and the Tennessee Titans, each of whom had 21 turnovers this season. But the Chargers rank 15th in most EPA lost on those, while the Titans rank 25th. In other words, the Titans' turnovers didn't have as much of an impact.
The same metrics can be applied to the defensive side of the ball.
It's important to note that while EPA lost is bad for the offense, it's good for the defense because the stat is taking away the expected points the opposing offense was in position to get.
The table below shows how much EPA each team’s opponent lost from turnovers.
| Team | Turnovers Forced | EPA Lost By Opponent |
| Giants | 30 | -144 |
| Ravens | 31 | -140 |
| Bills | 30 | -131 |
| Dolphins | 27 | -128 |
| Steelers | 27 | -126 |
The Miami Dolphins and Pittsburgh Steelers forced very costly turnovers — they tied for 11th in the NFL in turnovers forced but ranked No. 4 and 5 in how much those turnovers hurt their opponents. The New York Giants did a great job of taking the ball away; the turnovers their defense forced took away approximately 144 points throughout the season (over eight points a game).
Offensive and defensive numbers are great, but combining them is where the true impact of turnovers becomes evident. If we take the EPA lost from offensive turnovers and add the EPA lost from defensive turnovers, we get a NET Turnover EPA.
Again, a negative number here is good for a team’s defense.
| Team | Turnover Differential | NET EPA |
| Giants | +11 | -62 |
| Steelers | +10 | -51 |
| Cowboys | +11 | -50 |
| Ravens | +12 | -50 |
| Saints | +14 | -41 |
| 49ers | +10 | -41 |
| Bengals | +10 | -38 |
| Buccaneers | +9 | -37 |
| Texans | +5 | -36 |
| Bills | +2 | -27 |
A couple of things stand out: First, the Giants wasted their great turnover differential (worth almost four points a game). Second, while the Buffalo Bills didn't have a great turnover differential, the turnovers their defense generated had a more significant impact than the turnovers their offense committed, vaulting them into the top 10 in NET Turnover EPA. Finally, only three of the 10 teams on this list didn't make the playoffs — compared with five of the 10 teams on the list looking only at turnover differential.
Good teams don't just win the turnover battle — they generate turnovers that make an impact, and the ones they commit don't.
Just as we can look at Turnover EPA on a team level, we can also look at it from a player level.
| Player | Turnovers | EPA Lost |
| Sam Howell | 24 | -108 |
| Desmond Ridder | 19 | -87 |
| Bryce Young | 16 | -87 |
| Trevor Lawrence | 20 | -83 |
| Jalen Hurts | 19 | -82 |
It's no surprise to see the NFL leader in turnovers sitting atop the EPA lost column, but one obvious player missing is one who tied for second in turnovers with 20: Josh Allen. Allen ranks 10th in EPA lost on his turnovers, again showing they didn't have as much of an impact, while Bryce Young shoots up to third (nearly second) with fewer, but costlier, turnovers.
Defensive players have nowhere near the number of turnovers forced as offensive players have, but their impact may not be as far off as expected, especially when a defensive touchdown happens.
| Player | Turnovers Forced | EPA Lost By Opponent |
| DaRon Bland | 9 | -48 |
| Jessie Bates | 8 | -34 |
| Geno Stone | 7 | -28 |
| Antoine Winfield Jr. | 8 | -25 |
| Tyrann Mathieu | 4 | -25 |
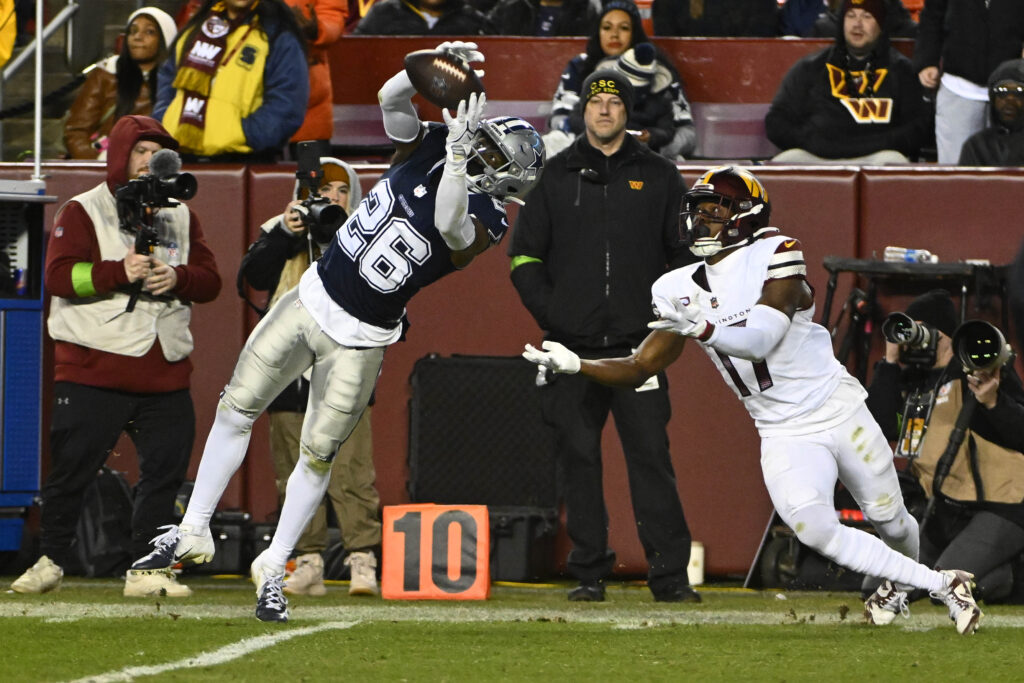
Again, the leader on the above chart shouldn't be a shock. DaRon Bland not only had an NFL-leading nine turnovers forced, five were returned for touchdowns. The biggest surprise here might be Tyrann Mathieu, who, in the EPA lost column, jumped over more than a dozen defenders who forced more turnovers than he did. With 25 EPA lost by the offense on just four forced turnovers, each turnover was worth more than six points to his team (on pace with Bland).
Turnovers are a crucial part of the game, and looking just at turnover differential can be a decent picture of how a team is doing.
But for a more complete picture, looking at Turnover EPA can be one useful tool to help add context to the turnovers. The majority of teams who succeed in NET Turnover EPA will be looking to make a deep run in this postseason, and they can at least feel confident in their ability to win that battle.
This article was written by Jeff Dean.


